Data Visualization is the hottest topic among businesses nowadays.
Today, businesses are sitting on mountains of data that have a goldmine of information. That information, once properly deciphered, can be exceptionally useful for them to make better, data-driven decisions. And to do the same effectively and as desired, leveraging latest data visualization trends is the key.
According to Tableau, managers in organizations with visual data discovery tools are 28% more likely to find timely information than those who rely on managed reporting and dashboards. Additionally, these business insights also help uncover new business openings.
As its importance grows, the number of businesses that are turning to the art of data visualization is increasing. It seems new tools and new capabilities are coming out every other day. Data scientists and analysts use them to push the boundaries and extract more meaning and value from the data at hand.
Clearly, it is crucial for every business to understand the trends of data visualization. But, before we discuss data visualization trends, let us first take up a basic question.
Why is Data Visualization Important?
Data visualization is defined as the graphical representation of data and information. With the help of visual elements like graphs, charts, and diagrams created using data visualization tools, it provides an accessible way to understand patterns and trends in the data.
The answer to why data visualization is important is because of the well-known fact that the human brain has a remarkable ability to remember pictures.
For us, humans, the data in graphs or charts is easier to understand as compared to data in long spreadsheets or reports.
Data visualization is an easy and quick way to fetch concepts in a broad manner – and you can try different things with various situations by making slight modifications.
A good data visualization can help you identify trends in the following ways:
- Recognize areas that need consideration or improvement
- Clear up which factors impact user behavior
- Help you know which products to place where
- Foresee sales volumes
To have a more clear vision of data visualization, let’s discuss the top 7 data visualization trends that will make your visual designs even more important in the years to come.
7 Data Visualization Trends to Watch Out For In the Years to Come
-
Data Beyond Visuals
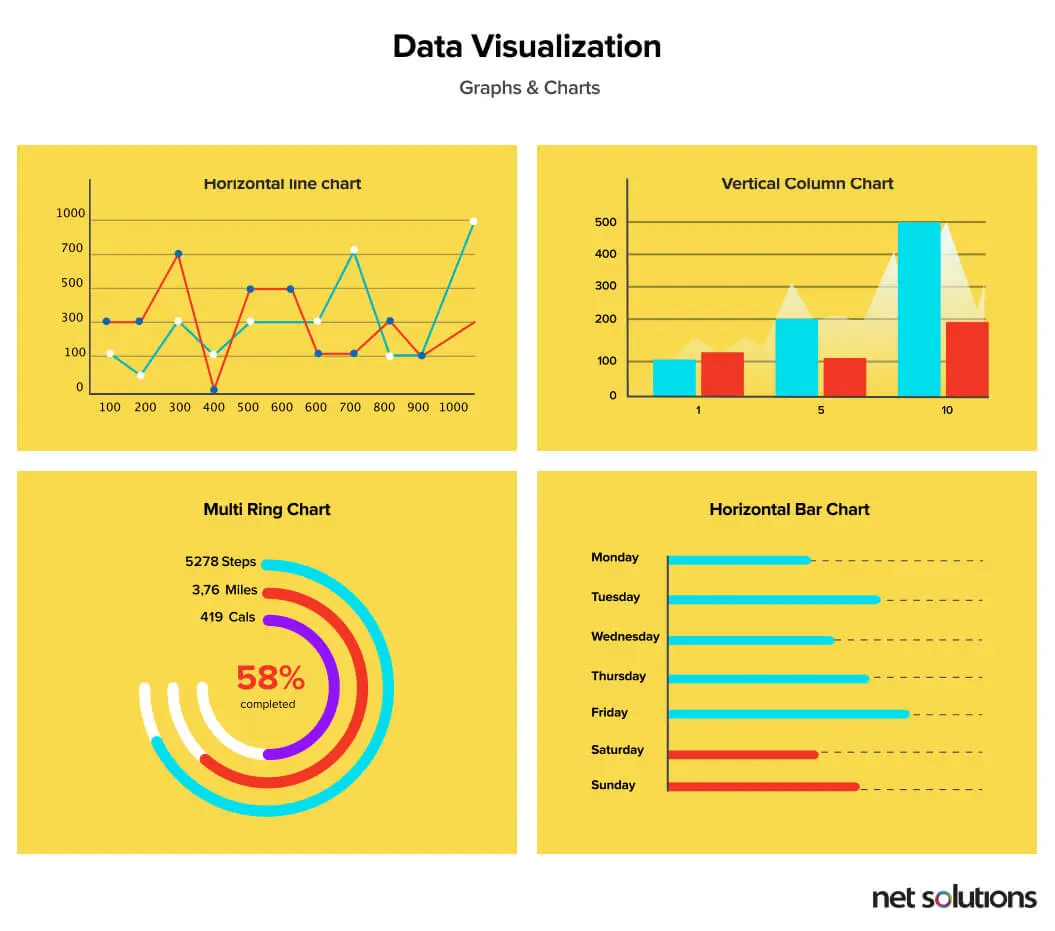
Data visualization is not just about visuals. There are a lot more things under the hood. Many people get stuck on the charts and graphs because that’s the most obvious part of any platform. But beyond these standard visuals, data must be capable of informing and empowering teams to gain significant knowledge – that’s how data visualization trends are going to evolve in the years to come.
The use of modern technology and tools such as google charts, modest maps, visually keep enhancing the world of new data visualization. The use of interactive maps and infographics is mostly used to “inform and motivate” users to effectively make creative data visualization dashboards without coding skills.
-
Data Viz is More Social
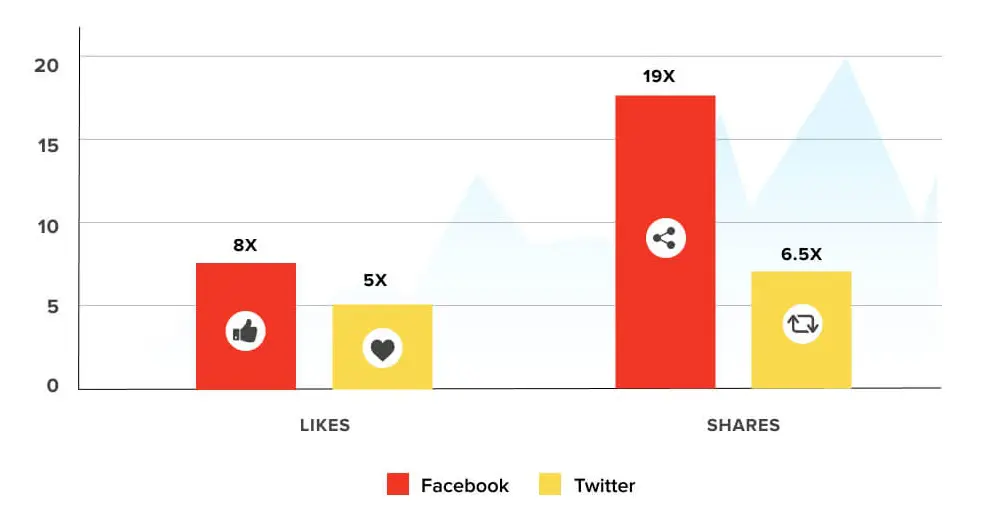
Another new data visualization trend is using social platforms for steering better engagements. Data researchers have also recognized this trend and are taking care to make DataViz social media friendly.
Since the attention span of social media users is very low, your data must be presentable and visually attractive. Data viz for social sharing follows the “less is more” process. A few instances of social media visualizations include 3d animation, GIFs, and YouTube shots.
-
Data Democratization
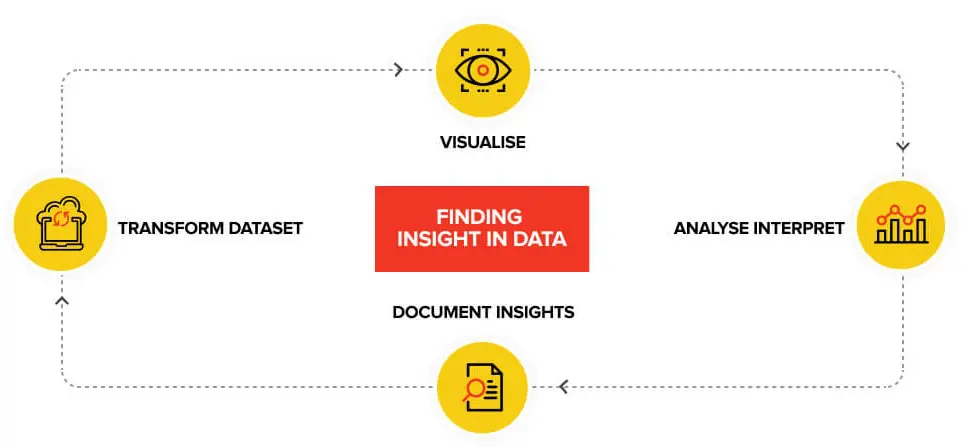
One of the most important trends in data visualization is data democratization where anybody can use data at any time to make decisions without any boundaries to access or understand. The best data visualization tools play a significant role in democratizing data & analytics and making data-driven insights accessible for users through an organization.
It empowers users to access and visualize data via drag and drop, build interactive dashboards and personalize them with a few clicks. This further helps in enhancing income-generating pportunities, and create data-driven offerings for decision making.
-
Data Storytelling
“Numbers have an important story to tell. They rely on you to give them a clear and convincing voice”
– Stephen Few, Data Visualization Guru
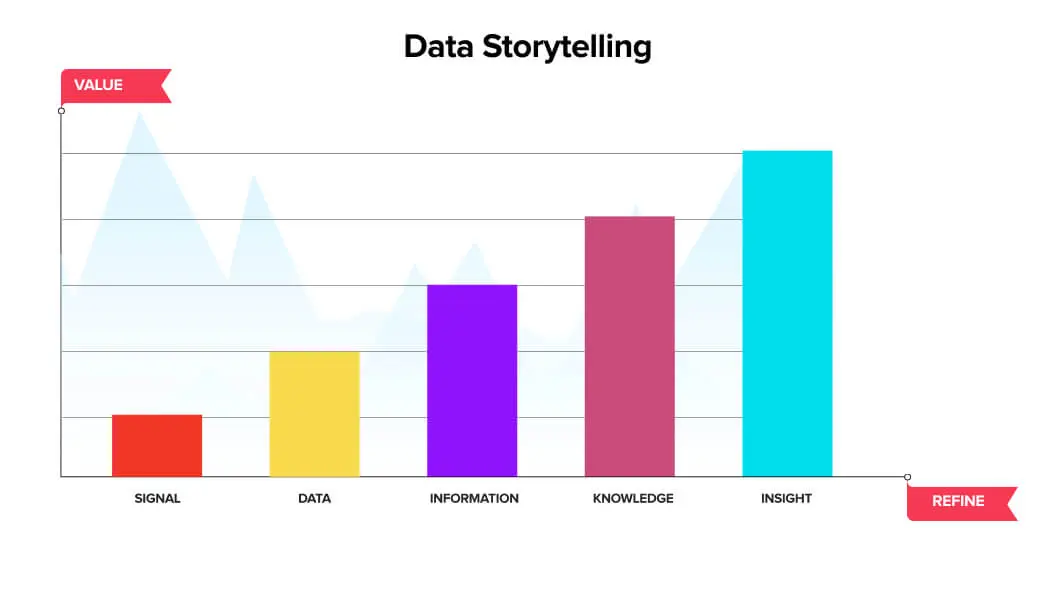
There’s no surprise that humans love stories. And the idea of creative data visualization for storytelling is picking up ubiquity. Just visualizing the data is not enough. Visualizers need to move toward becoming storytellers who can distinguish and communicate great experiences to the cutting edge.
Visualization data is nowadays more of storytelling where the content is customized, easy to understand with a good start and strong ending. Forming simple stories from complicated data may be a daunting task, but if done right, this data visualization trend will take you ahead of your competitors.
-
Data Journalism is Going Mainstream
With the accessibility of data as well as great tools to visualize and analyze, we see an increase in the number of unimaginable data visualizations released by the top media organizations over the globe. Data visualization is getting fame in the field of news reporting.
The adequacy and reach of data journalism is probably going to persuade an ever increasing number of editors and journalists. It occupies less screen-space by incorporating and summarizing data in a way that gives more time to the reader.
-
Artificial Intelligence
Artificial intelligence is getting into every industry and is also playing a crucial role in setting business intelligence trends for the years to come. AI-based data visualization helps businesses discover what data they should be looking at in the massive pool of data available today.
There is a lot of data available nowadays which involve critical insights that can yield better results. Machine learning and natural language processing (NLP) can cooperate to divulge important insights from data, thereby overcoming the data visualization workload for humans.
-
Mobile-Friendly Data
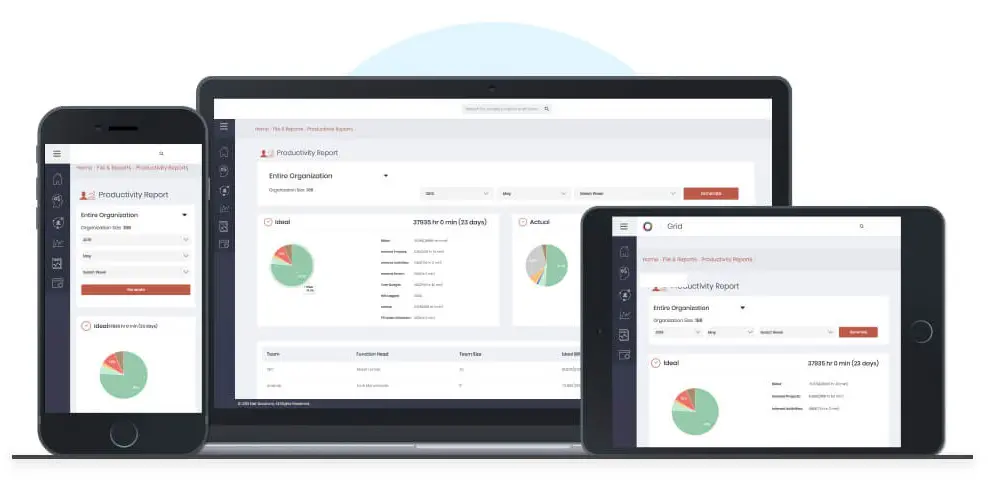
As the world is fully controlled by mobile customer experiences today, mobile-friendly data is one of the future trends in data visualization. DataViz Mobile is gaining popularity and many vendors are dealing with adapting desktop experiences to mobile formats to include the mobile-first approach.
So, it’s very crucial to engage the mobile audience by offering a great data viz experience on their smartphones. For example, like last year, consumer electronics giant Apple acquired Mapsense, a mobile data visualization startup for $30 million.
Now that we have seen all the trending and new data visualization trends, let us uncover some of the best data visualization tools that can help you handle large sets of data easily and efficiently.
-
It empowers users Data Beyond Visuals

Data visualization is not just about visuals. There are a lot more things under the hood. Many people get stuck on the charts and graphs because that’s the most obvious part of any platform. But beyond these standard visuals, data must be capable of informing and empowering teams to gain significant knowledge – that’s how data visualization trends are going to evolve in the years to come.
The use of modern technology and tools such as google charts, modest maps, visually keep enhancing the world of new data visualization. The use of interactive maps and infographics is mostly used to “inform and motivate” users to effectively make creative data visualization dashboards without coding skills.
-
Data Viz is More Social

Another new data visualization trend is using social platforms for steering better engagements. Data researchers have also recognized this trend and are taking care to make DataViz social media friendly.
Since the attention span of social media users is very low, your data must be presentable and visually attractive. Data viz for social sharing follows the “less is more” process. A few instances of social media visualizations include 3d animation, GIFs, and YouTube shots.
-
Data Democratization

One of the most important trends in data visualization is data democratization where anybody can use data at any time to make decisions without any boundaries to access or understand. The best data visualization tools play a significant role in democratizing data & analytics and making data-driven insights accessible for users through an organization.
It empowers users to access and visualize data via drag and drop, build interactive dashboards and personalize them with a few clicks. This further helps in enhancing income-generating opportunities, and create data-driven offerings for decision making.
-
Data Storytelling

“Numbers have an important story to tell. They rely on you to give them a clear and convincing voice”
– Stephen Few, Data Visualization Guru
There’s no surprise that humans love stories. And the idea of creative data visualization for storytelling is picking up ubiquity. Just visualizing the data is not enough. Visualizers need to move toward becoming storytellers who can distinguish and communicate great experiences to the cutting edge.
Visualization data is nowadays more of storytelling where the content is customized, easy to understand with a good start and strong ending. Forming simple stories from complicated data may be a daunting task, but if done right, this data visualization trend will take you ahead of your competitors.
-
Data Journalism is Going Mainstream
With the accessibility of data as well as great tools to visualize and analyze, we see an increase in the number of unimaginable data visualizations released by the top media organizations over the globe. Data visualization is getting fame in the field of news reporting.
The adequacy and reach of data journalism is probably going to persuade an ever increasing number of editors and journalists. It occupies less screen-space by incorporating and summarizing data in a way that gives more time to the reader.
-
Artificial Intelligence
Artificial intelligence is getting into every industry and is also playing a crucial role in setting business intelligence trends for the years to come. AI-based data visualization helps businesses discover what data they should be looking at in the massive pool of data available today.
There is a lot of data available nowadays which involve critical insights that can yield better results. Machine learning and natural language processing (NLP) can cooperate to divulge important insights from data, thereby overcoming the data visualization workload for humans.
-
Mobile-Friendly Data

As the world is fully controlled by mobile customer experiences today, mobile-friendly data is one of the future trends in data visualization. DataViz Mobile is gaining popularity and many vendors are dealing with adapting desktop experiences to mobile formats to include the mobile-first approach.
So, it’s very crucial to engage the mobile audience by offering a great data viz experience on their smartphones. For example, like last year, consumer electronics giant Apple acquired Mapsense, a mobile data visualization startup for $30 million.
Now that we have seen all the trending and new data visualization trends, let us uncover some of the best data visualization tools that can help you handle large sets of data easily and efficiently.
10 Top Data Visualization Tools to Help You Handle Data
The requirement of big data visualization tools can be deduced from the fact that the global business intelligence and analytics software market is predicted to rise from just $13.9 billion in 2018 to $16.5 billion by 2023, as per Statista.
This tremendous data visualization growth is driven by businesses’ inclination towards collecting and analyzing, actionable data for making informed decisions. Here is the list of best data visualization software that are perfect for users to pick from without any expertise or technical knowledge.
-
Tableau
Tableau is considered as one of the best interactive data visualization tools that helps people understand and visualize their data. It is broadly utilized in the field of Business Intelligence (BI) and is often just called a BI tool or a mobile data visualization tool (It also offers a mobile app that lets you stay at the top of your data, always).
The tool enables you to develop and design interactive maps, graphs, charts, and so on, in the form of dashboards and worksheets to acquire insights.
Users just need to drag & drop their data into the system and view updates in real-time. Also, you can work together with other colleagues for a quick project turnaround. You can share your data as well as dashboards quickly with Tableau on the web and Tableau server.
-
Qlik Sense
Qlik Sense is a well-known data visualization software. Its main focus is to work with a cooperative QIX engine. This engine empowers the users to connect and link data from various sources to do the analysis. Qlik Sense helps as a data analysis platform for a wide range of users, for example, from non-specialized to specialized users.
Being one of the best data visualization tools for businesses, Qlik Sense offers a lot of flexibility to the users as they can do totally self-ruling activities with self-service visualizations and analysis. They can even be managed by the automated machine-guided analysis by the cognitive engine of Qlik Sense.
-
Microsoft Power BI
Microsoft Power BI is a business analytical tool that helps businessmen to analyze their data visually and make strategies accordingly. It gives access to on-premise and in-cloud data. It has two pricing plans, one of which is free.
The free version comes with 1GB data that allows users to create, make and share dashboards and data reports. The Power BI Pro has all power with BI features and can consume data with full interactivity, share data related queries via Data Catalog and considerably more.
-
Domo
Domo is a perfect option to pick for the companies when it comes to looking for a self-service analytics and visualization solution. The platform mainly emphasizes on social collaboration that allows users to communicate through contextual data, messaging, and notifications that inform all stakeholders about updates and changes to data sets.
Domo stands out for how easily one can access the data even on a small mobile screen. The platform has the highest number of accessible data set connectors, including the most popular data sources, for example, Amazon Web Services, Google Analytics, and more than 350 different streams. Most importantly, its pre-built solutions for a variety of industries make it a flexible and dynamic web and mobile data visualization tool.
-
Sisense
Sisense offers an easy-to-use interface which is user-friendly and imparts a problem free task to the non-techies. It does an ad-hoc analysis of high volume data. It even empowers you to assemble data from all the sources into a single and available store, making it a single platform that manages the whole BI workforce. It can also analyze data progressively.
For example, during peak season, the trends in sales need to be checked in order to offer a quick insight into the collected data which can be traced as it occurs. Its prominent customers include NASA, Merck, eBay, ESPN, and SONY.
-
SAP Lumira
SAP Lumira was formerly known as visual intelligence. It is a self-service visualization tool that allows business users to connect, visualize, communicate, and discover information contained in large data sets.
Lumira can connect with a large number of data sources, both online and offline. It is somewhat unique in its capabilities of blending them all together in a repeated way. For example, it brings data to life by creating best interactive data visualization maps and infographics based on live data. It is available for individuals, SMEs, and big enterprises.
-
TIBCO Spotfire
Tibco Spotfire, analytics and business intelligence platform, gives business users a speedy understanding of data. It is available in Desktop, Cloud, and Platform Editions. It has an AI-based recommendation engine that reduces data discovery time.
The data wrangling features of TIBCO Spotfire encourages you to quickly find data outliers, irregularities, and insufficiencies. In the year 2010 World Cup, FIFA used this software to give viewers data analytics on teams’ past performances as per countries. The list of Spotfire power users includes Procter and Gamble, Cisco, NetApp, Shell.
-
MicroStrategy
MicroStrategy is a self-service BI platform that supports both data mining as well as data visualization. With the help of power analytics, the features like intuitive toolset and built-in templates help Micro Strategy to build all kinds of effective data visualizations.
Designed for an individual business user, it is quick and user-friendly with quick installations and downloads. It can connect with personal spreadsheets, cloud-based data sources such as Facebook, Hadoop, and other big data sources. The enterprise platform can support both web as well as mobile apps for easy and effective business.
-
ThoughtSpot
ThoughtSpot is an AI-based analytics platform for businesses. It is more of a search engine than a traditional data visualization tool. It can be used by anyone to make data oriented searches. It helps analyze the data of the companies in seconds and get insights quickly using its powerful engine.
It is a data analytics solution that enables all members from your business to ask queries of your data through Relational Search Engine. Also, users can question structured data through a Google-like search bar and receive answers as quickly as possible.
-
Looker
With the help of Looker, data visualizations are based on fresh data right from the source and they update progressively. Whenever you need to know more, you can drill from the visualization into row-level detail. One can select visualization from the Looker’s library and build your own.
With the team-oriented business intelligence platform of Looker, you can create as well as customize visualization by employing a single code. Then you can design more difficult visualizations. You can create & share data reports, analytics, and design your own analytic modules using SQL.
What is the Future of Data Visualization?
While finding data is no longer a challenge for data analysts today, the overall quality of data visualization is something that will matter most in the years to come.
That means data visualizers must select and feed the right source of data to make strategies that really work. On that note, the future of data visualization surely lies in emerging technologies like Artificial Intelligence, Machine learning, AR, and VR that are redefining customer experiences.
Where AI and ML are proving effective in capturing important business insights from data using its NLP (Natural Language Processing) abilities, technologies like AR and VR are providing visual controllers to viewers for exploring data sets. Also, using virtual reality, now you can visualize, manage, and analyze data in a 360-degree virtual space to make informed decisions.
Conclusion
Data visualizations have turned into a vital part of the business world and an ever-increasing part that manages our daily life in this sophisticated digital age! So, utilize your year 2019 by grasping the above-given data viz trends before getting started with data visualization.
Remember the better you comprehend data, the more you understand how to overcome business challenges get information, the more prepared you’ll be to conquer business challenges and increase customer satisfaction.


