
Is your eCommerce website performing well? Are you spending your advertising
budget wisely? Find answers to these questions by reading about 15 eCommerce APIs to track your eCommerce website performance.
Expanding the online presence of a business is the key to its success in today’s digitally dynamic
world. Many factors are involved in the smooth running of an eCommerce solution, and companies
must track all of them to ensure a seamless customer experience.
Businesses need clarification about KPIs to monitor their eCommerce website’s performance.
Most only track three KPIs: traffic, revenue, and sales eCommerce. They must remember many
vital aspects of tracking and enhancing their eCommerce business performance.
But not anymore. We have assembled a list of 15 eCommerce metrics to help streamline the
tasks and track the performance of your eCommerce business.
What is an eCommerce KPI?
eCommerce KPIs are like a milepost that help determine the progress of an eCommerce business
on its path to success. The eCommerce KPIs usually vary from business to business, depending
upon their business and functional requirements. Once the KPIs for eCommerce businesses are decided, they are regularly
tracked and monitored.
Some examples of eCommerce KPIs are bounce rate, time on site, cost of customer acquisition,
shopping cart abandonment rate, and conversion rate. These key eCommerce metrics help
businesses to lay a roadmap to accomplish their defined targets.
Why are
eCommerce KPIs Important?
Using time-tested strategies for your eCommerce business may seem like the way to go, but a
marketing plan that may have worked for one eCommerce development company
may have a different effect on yours. Therefore, enforcing an eCommerce strategy will only
do good if customized to fit your business needs. Once you have designed the roadmap, you
must check its success rate closely.
“If you can’t measure it, you can’t improve it.”
– Peter Drucker
Many different metrics make up the eCommerce umbrella. Often, this can overwhelm an eCommerce
professional. They may focus too much on a single eCommerce metric making the success
visible on paper when, in reality, the overall performance could improve more.
Instead, as an eCommerce professional, you must focus on the interdependencies between each
eCommerce KPI. It will help to get an effective revenue-generating plan.
15 best eCommerce
metrics to track your website performance
There are various tools available to measure, analyze, benchmark, and improve the experience
on your digital commerce website across
multiple channels by helping you track the following eCommerce KPIs:
- Conversion Rate
When users visit your site, you want to qualify them into leads and
convert them into buyers. Routing them in the right direction is vital and needs to
be strategically done.The global average conversion rate is between 1-3%. It may be even
higher for some of the best marketers, but achieving even the average number can
affect the profit.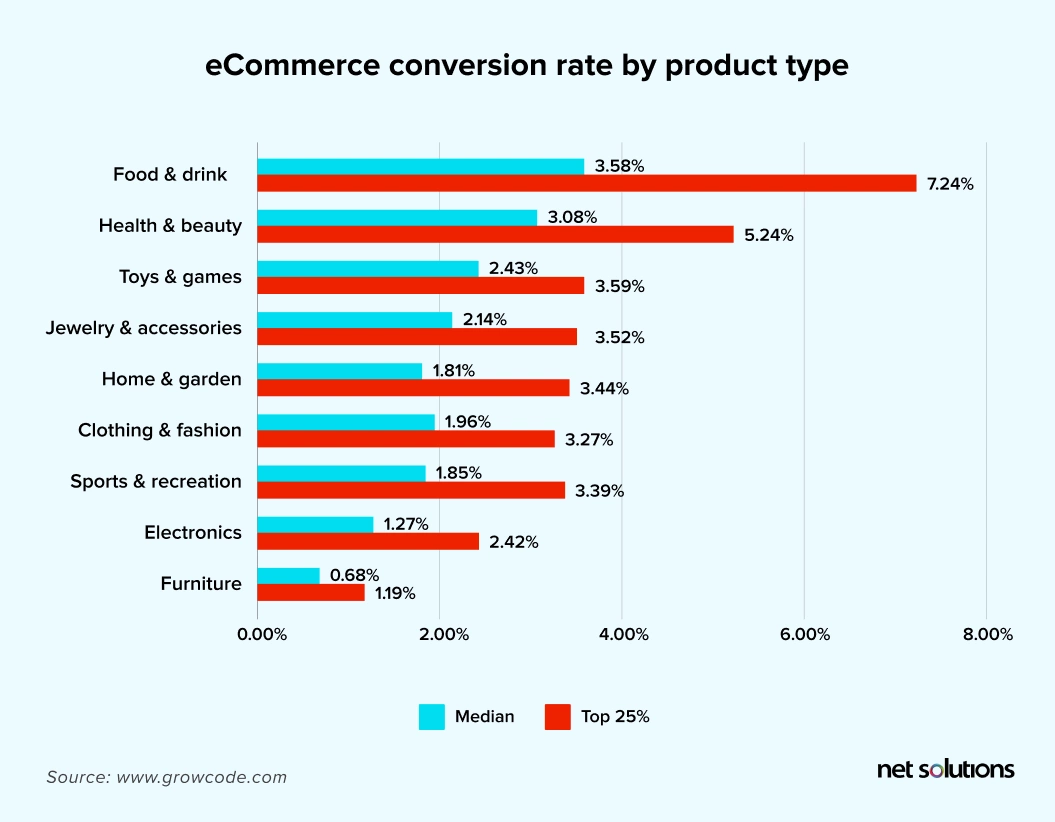
Businesses can optimize conversion rate by creating an intuitive
call to action, A/B testing for improvements, and simplifying the checkout process.
Even though increasing the conversion rate should be your primary motive, you also
want your customers to become loyal to your brand. So, define your conversion rate
eCommerce KPI based on these parameters.You need to know your goals and define ways to achieve them. Don’t
stick to one method only. Keep experimenting with new ideas until you find the best
method suited for your business.
- Churn Rate
Customers may only sometimes be satisfied with the service they
receive from the company. Creating a solid relationship with your customers should
be a top priority. Unhappy customers can stem from either underperforming products
or unsatisfactory customer service.Embracing a multi-channel customer service system and delivering
positive customer experiences are the most significant factors that help retailers
turn visitors into satisfied customers and satisfied customers into loyal ones.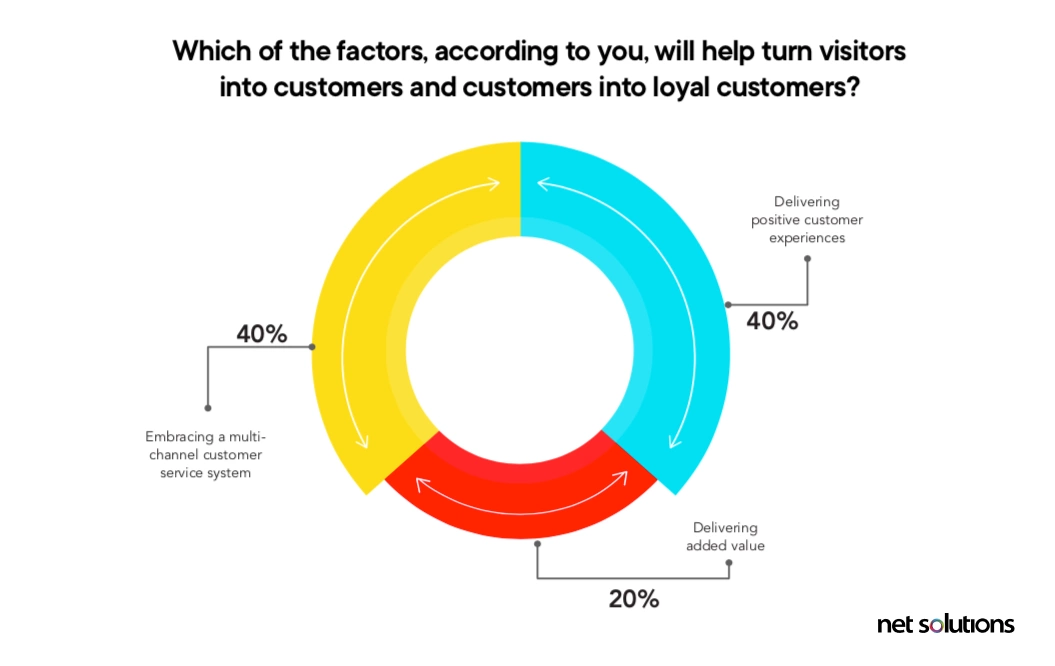
A poor experience can leave them with a bad taste, which may
irritate them to the point where they write negative reviews about you online.
Providing exceptional service can leave a lasting impression on your customers, and
they will keep returning to do business with you.The churn rate, one of the vital eCommerce KPIs, is the number of
customers that discontinue their subscription to your business after a specific
time. A low churn rate means you have a happy customer base. The average monthly
churn rate of a SaaS company is 3-8%,
and the average annual churn rate is 32-50%.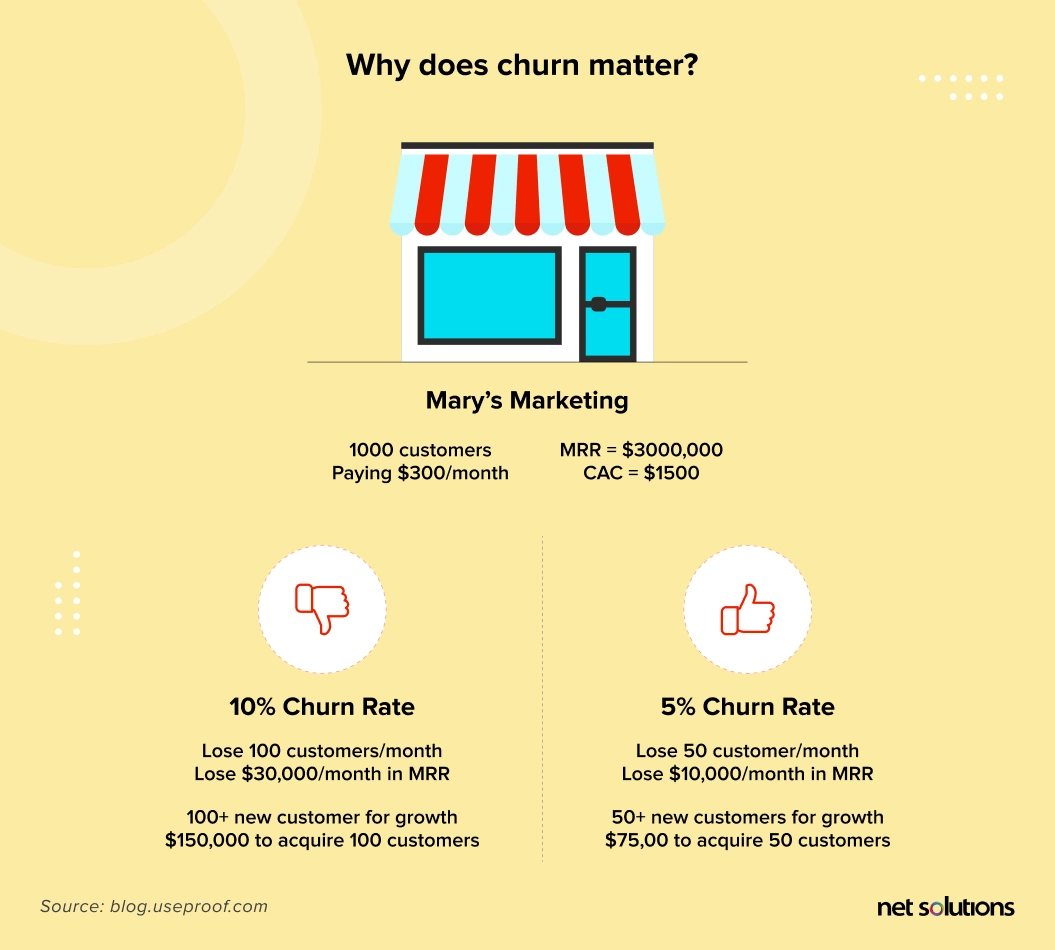
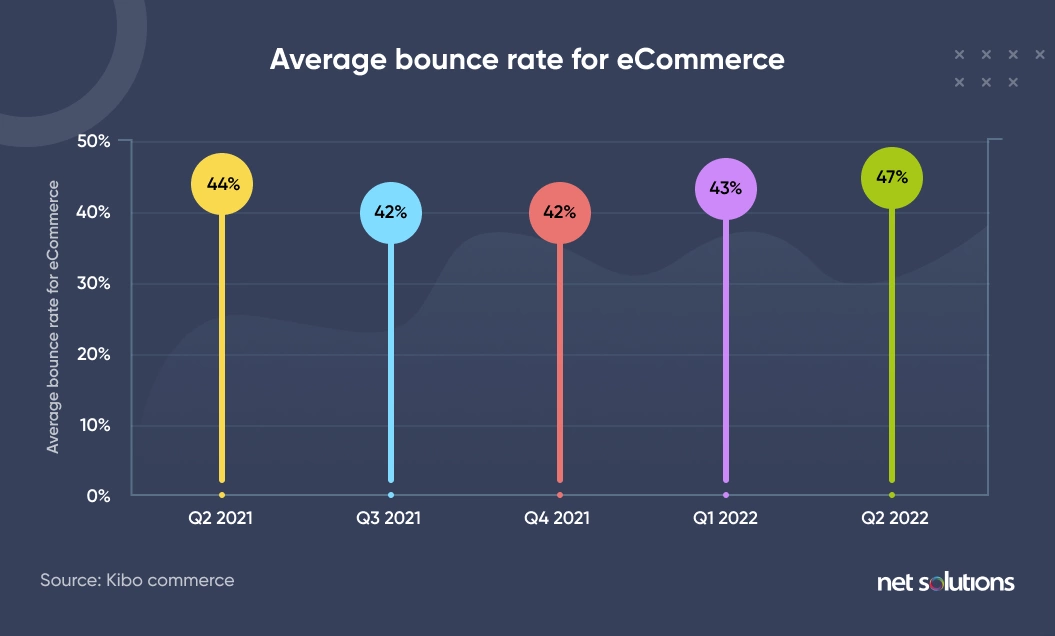
- Bounce Rate
According to Google
Analytics, bounce rate is the percentage of visitors who immediately jump
off after visiting a web page. In simple terms, this eCommerce KPI helps a business
analyze the number of visitors leaving their website after viewing only a single
page. The higher the bounce rate is, the more alarming it is for your website.What is an ideal eCommerce bounce rate benchmark for any website?
- Return Customer Rate
If your company offers different products or services, you want your
customers to come back to purchase all of them. But this may only sometimes be true,
especially if your products are sub-par. Hence, you must value and incentivize
returning customers to ensure they keep purchasing from you.The probability of selling to an existing customer is 60%–70%. But the
probability of selling to a new customer is 5%–20%.– Altfield
The return customer rate or the repeat purchase rate is the rate at
which former customers come back to purchase other products from you. A return rate
between 20%-40% is admirable, while those with a rate above 35% can see a
significant increase in revenue.You can increase the return rate through several initiatives to
engage customers, including notifying and updating your products. Creating schemes
and programs to reward your return customers is a proven way of bringing back your
clientele. It is a crucial eCommerce KPI that helps strengthen your bond with
existing customers. - Net Promoter Score
A happy customer tells a friend. An unhappy customer tells the world.
Your customers are free advertising modes that, if treated well, can
propel your business forward. If your customers are satisfied with your service,
they will recommend you to a friend, and the cycle continues. But an unhappy
customer may get so infuriated with the wasted time and effort on your service that
they may start writing your reviews online for the world to see.It is essential to get happy customers advertising your products.
The willingness of customers to recommend your service to friends is the net
promoter score. It is graded from 0 to 10. This score can account for 20% to 60%
of a company’s organic growth.Quality products will get your customers talking, but every product
could be better. Many times your consumers will find faults in them. Effectively
handling these complaints is the key to a high net promoter score – an important KPI
metric.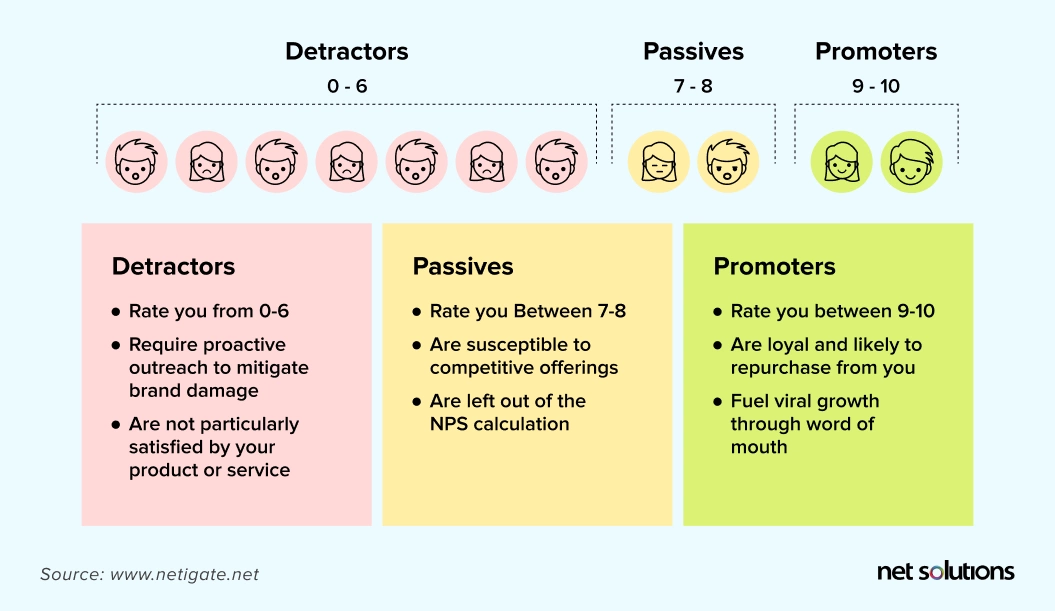
- Average Profit Margin
Online businesses must differentiate the products that generate
large and small profit margins for success. Comparing the profit margins help
identify the most profitable categories and products in your online store.Average Profit Margin is one of the critical eCommerce KPIs
representing the actual picture of profit or loss across all the products, thus,
helping a B2C or B2B eCommerce platform
owner to lay a roadmap focussed towards resources for growth.Although an average profit margin may vary from company to company,
per studies, the average eCommerce gross
margin is approximately 42%. - Cart Abandonment Rate
eCommerce sites offer a virtual cart feature for customers who want
to select multiple items simultaneously. Consumers choose the products they are
interested in and add them to their virtual carts, and they can then order them at
their leisure. You may often notice that your customers add items to their cart but
need to place the order.The rate of potential customers who leave without buying any product
is the cart abandonment rate – one of the vital eCommerce KPIs. The average
abandonment rate documented online is 69.99%.
Some ways to reduce shopping cart
abandonment include email retargeting, allowing guest checkout, and
eliminating surprise costs.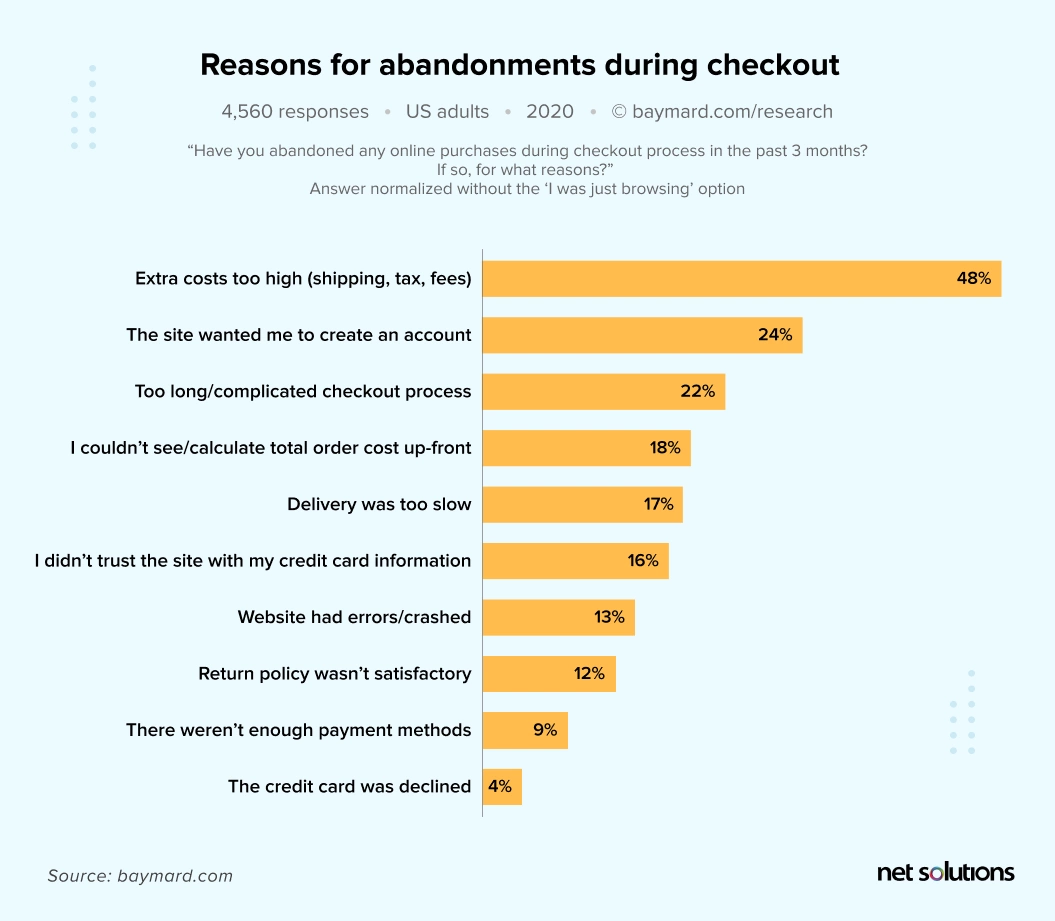
- Customer Lifetime Value
Customer lifetime value is a vital eCommerce metric that helps shape
the customer retention strategy. In any eCommerce Model,
gaining new prospects is more costly than retaining existing ones.Existing customers are an essential source of revenue generation for
every business. Thus, improving customer lifetime value is one of the savvy
retailers’ primary variables and goals while building any growth strategy.One of the surest ways to steer the growth of existing customers is
to deliver above and beyond service, which we call customer improvement, highlighted
in the Net Solutions’ GROWTH + RETENTION – (G.R.O.W.)th Model.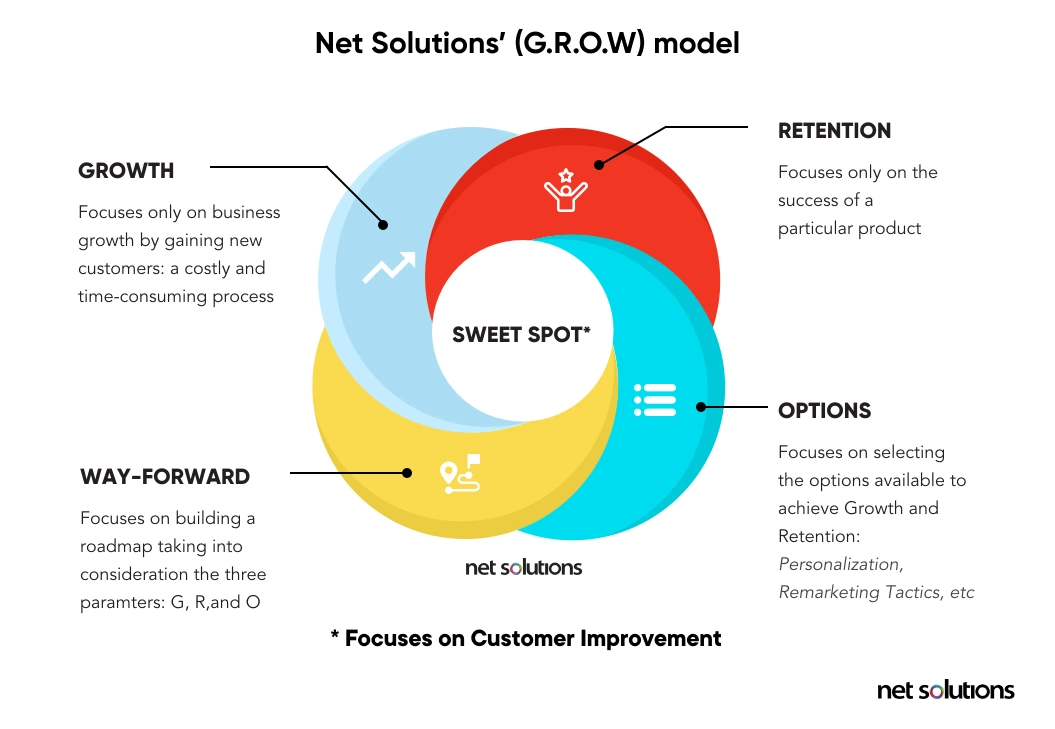
Customer lifetime value eCommerce KPI helps businesses analyze the
average revenue their potential customers will spend with their business over an
estimated lifespan. Customer lifetime value also determines how much your customers
love your products or services and how to improve them further.Formula: CLV (Historic) =
(Transaction1+Transaction2+Transaction3…+TransactionN) x Average Gross Margin - Cost Per Acquisition (CPA)
Many eCommerce KPIs, for example, conversion rate, are good
indicators of business success. But is there any eCommerce metric that highlights
the money spent on acquiring a new customer?Cost Per Acquisition (CPA) or customer acquisition cost is one of
the financial KPIs for eCommerce businesses that helps measure the revenue impact of
a company’s digital marketing campaigns. Simply put, CPA is a marketing eCommerce
KPI that showcases the average cost required to acquire one paying customer on a
channel level.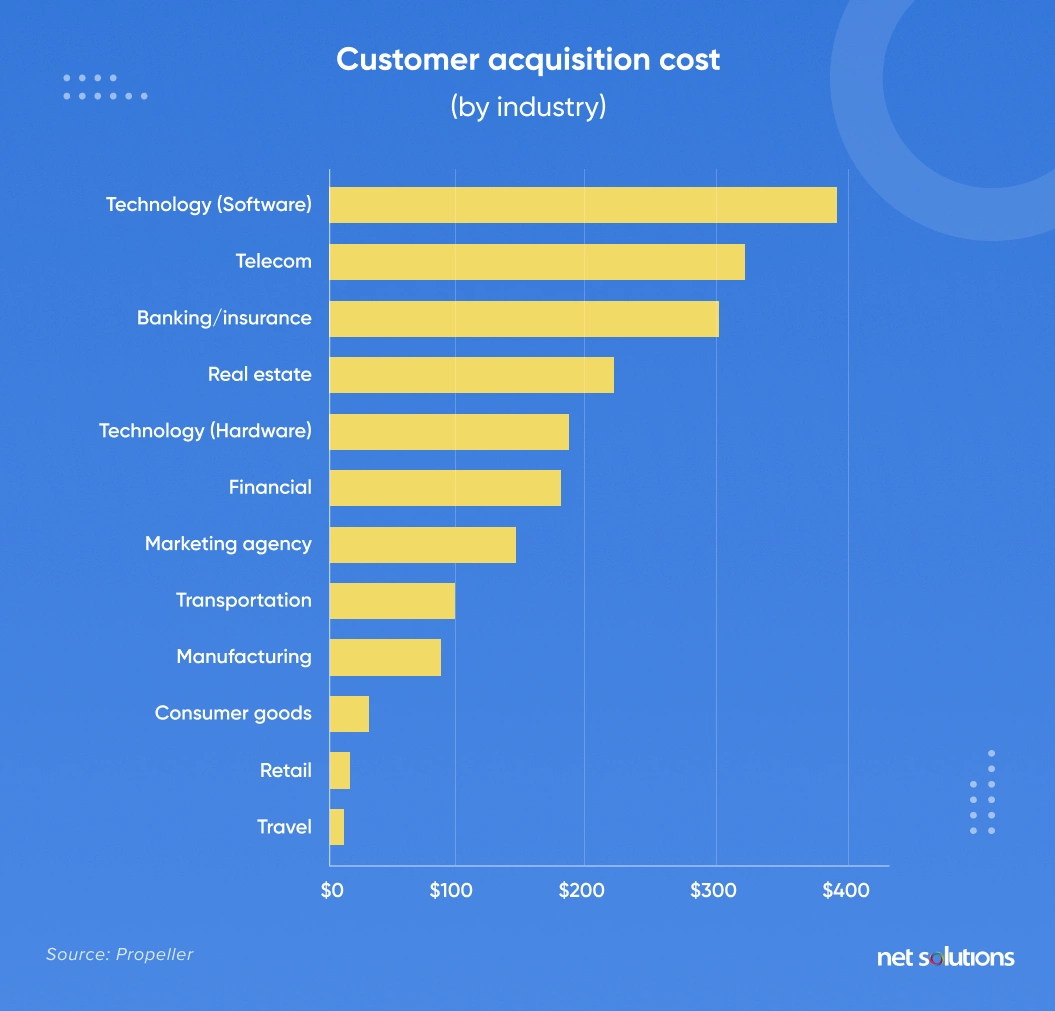
- Average Order Value (AOV)
Using Cost Per Acquisition eCommerce KPI, you can estimate the cost
required to grow your customer base. However, it is equally vital to understand the
amount your target customers spend or the number of orders they place on your
website. That’s where the Average Order Value (AOV) comes into play.Average Order Value is among the critical eCommerce KPIs that help
businesses to make data-driven decisions by getting valuable insights from the
customer’s buying patterns, product pricing, and online advertising spending.If the cost of gaining a new customer outweighs the amount they
spend on your website, it implies you are at a loss and need to improve your eCommerce strategy.Several ways to improve your AOV include:
- Improving the checkout experience.
- Encouraging visitors to purchase more items in a single transaction.
- Raising the product price.
- Add to cart rate
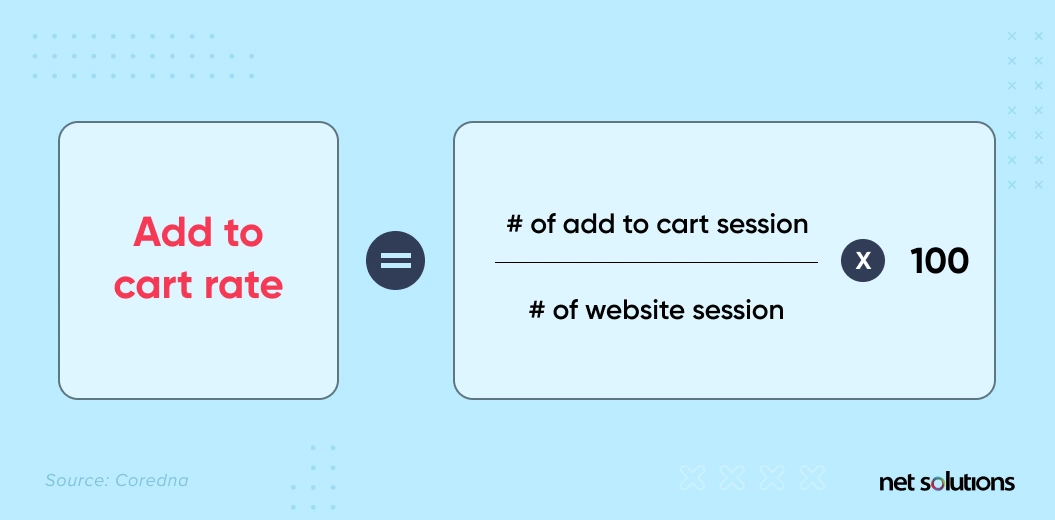
More than attracting visitors to your website is required. You must
also ensure that you’re attracting the right audience and making them complete the
next step (adding products to the cart). Add to cart is an essential eCommerce KPI
that you must track, and it would let you know how many website visitors added
products to the cart.Here are a few other things you can know by adding to the cart rate:
- Do your website visitors have a purpose in mind, or they’re just looking around?
- Have you set the price of your product right, or is it too high?
- Do your products meet your customers’ expectations?
- Refund or return rate
Refunds or returns are common in the eCommerce industry. But if
customers frequently return your products and ask for refunds, there’s a problem.The refund or return rate eCommerce KPI lets you track how much
percentage of orders customers return on your eCommerce
website. Here’s the formula to calculate the return or refund rate:RR = [(Current Value – Original Value) / Original Value] x
100A high return rate means your product fails to meet customer
expectations, and you must take necessary measures to improve it. - Revenue per visitor (RPV)
The revenue per visitor metric lets you know how much average
revenue you generate per visitor on your eCommerce website. It is an essential KPI
that enables you to identify all the bumps and quickly track your eCommerce
website’s performance over time.Here’s how you track revenue per visitor on an eCommerce website:
Revenue per visitor = Total income/number of visitors over a
specific periodIf you generated $200,000 in the last quarter and had 100,000
visitors on your eCommerce website, then the revenue per visitor will be $2. - Customer satisfaction score
Customer satisfaction is a core metric that can impact your
eCommerce business. If your customers are satisfied, it will succeed. Hence, you
must ensure that your customers are satisfied with your eCommerce Website Designs and performance at any cost.The customer satisfaction score is the metric you can use to measure
customer satisfaction. You can calculate it by asking a simple question in a survey:
“How satisfied were you with your experience?”Here’s the formula to calculate the customer satisfaction score:
Customer satisfaction score = Sum of all Scores / Total
Number of Respondents
- Return on investment (ROI)
Return over investment (ROI) is a great eCommerce metric to see how
much your investments paid off. Here’s how you track this metric:ROI = (Net income/ cost of investment) * 100
The higher the number, the better, which indicates that your
investments bear fruit.“If you’re able to get a positive ROI with your product, you can reinvest your
profits into growth, traffic, ads, and conversion rate optimization so you can
scale.”– Jonathan Aufray, Growth Hackers
It would be best to focus on improving your conversion rate while
reducing costs to increase your return on investment (ROI).
Frequently Asked Questions
1. Will the same eCommerce KPIs apply to B2B and B2C
eCommerce?
While we are discussing eCommerce, B2B and B2C eCommerce KPIs might differ as the marketing
strategies for both business types differ. In B2B eCommerce, the focus is on KPIs like page
views, average time on page, web store optimization, online vs. offline purchases, return on
investment, conversion rate, abandoned car rates, and total cost of ownership.
On the other hand, in B2C eCommerce, eCommerce KPIs
like website traffic, click-through rate, time-on-page, and customer acquisition cost take
center stage.
2. What are the three types of key performance indicators?
- Quantitative Indicators: These are the eCommerce KPIs you can calculate with
numbers. - Qualitative Indicators: You can’t measure these KPIs with numbers, but they give
you an overview of the quality of your eCommerce business. - Leading Indicators: These KPIs can predict the outcome of a process.
3. What are the characteristics of good KPIs?
Good eCommerce KPIs are transparent, relevant, comparable, cost-effective,
easy to understand, verifiable, and responsive.
4. What KPI does Amazon use?
Amazon uses KPIs like daily sales, conversion rate, site traffic, unit sales per week,
estimated lost sales, current inventory, and sales rank to track the performance of its
eCommerce website.